THE GHOST DISRUPTORS
Defensive Gravity: Mapping the Defenders, Opponents CHANGE THEIR OFFENSIVE TENDENCIES AROUND.
The wrong number
Imagine you're a sporting director with a budget, a defensive gap to fill, and a shortlist in front of you. You pull the defensive ratings. You sort by points allowed per possession. You eliminate the bottom half. Standard process.
But here is the thing nobody talks about: that number only measures what happens when an opponent decides to attack. And the best defensive players in the world are very, very good at making sure that decision never gets made. The ghost defender doesn't show up in your PPP-allowed column because the possessions that would hurt the column, the ones where a ball-handler turns the corner in pick-and-roll, the ones where a cutter catches clean at the rim. Those possessions simply stop happening when he is on the court. Opponents look at him, recalculate, and go somewhere else. The problem is that "somewhere else" has a cost. And until now, nobody has measured whether that cost lands on the opponent or on you.
OUR METHODOLOGY
We started with a simple premise: a defender changes the game in two ways. First, they can change what opponents attempt. Second, they can change how well opponents perform when they adjust. These are not the same thing. Not even close.
Deterrence is the first dimension. When a player is on the court, do opponents reorganise their playtype distribution, running fewer pick-and-rolls, fewer post-ups, fewer isolations in his direction? We measure this as a percentile across all EuroLeague players with sufficient data. A player at the 90th percentile for deterrence means opponents restructure more radically around him than 90% of the league.
Displacement is where things get interesting. When opponents restructure, where do they go? And critically, is the place they go better or worse for them?
Here is the key move in our methodology, and it matters. The baseline we use is not the defender's own numbers. It is each opponent team's own seasonal offensive efficiency per playtype. If a team ranks 3rd in the EuroLeague in pick-and-roll efficiency but ranks 17th in hand-offs, and they run fewer pick-and-rolls when our player is on the court and more hand-offs. That shift has a measurable cost to them. We compute that cost in points per 100 possessions, weighted by how much the mix actually changed.
A negative displacement score means opponents restructured into plays they are genuinely weaker at. They left their comfort zone and paid for it.
A positive displacement score means they found better plays by avoiding the player. They were deterred and rewarded.
the defensive mirror of truth
This is what EuroLeague defense looks like when you plot deterrence against displacement across all 137 players with enough data.
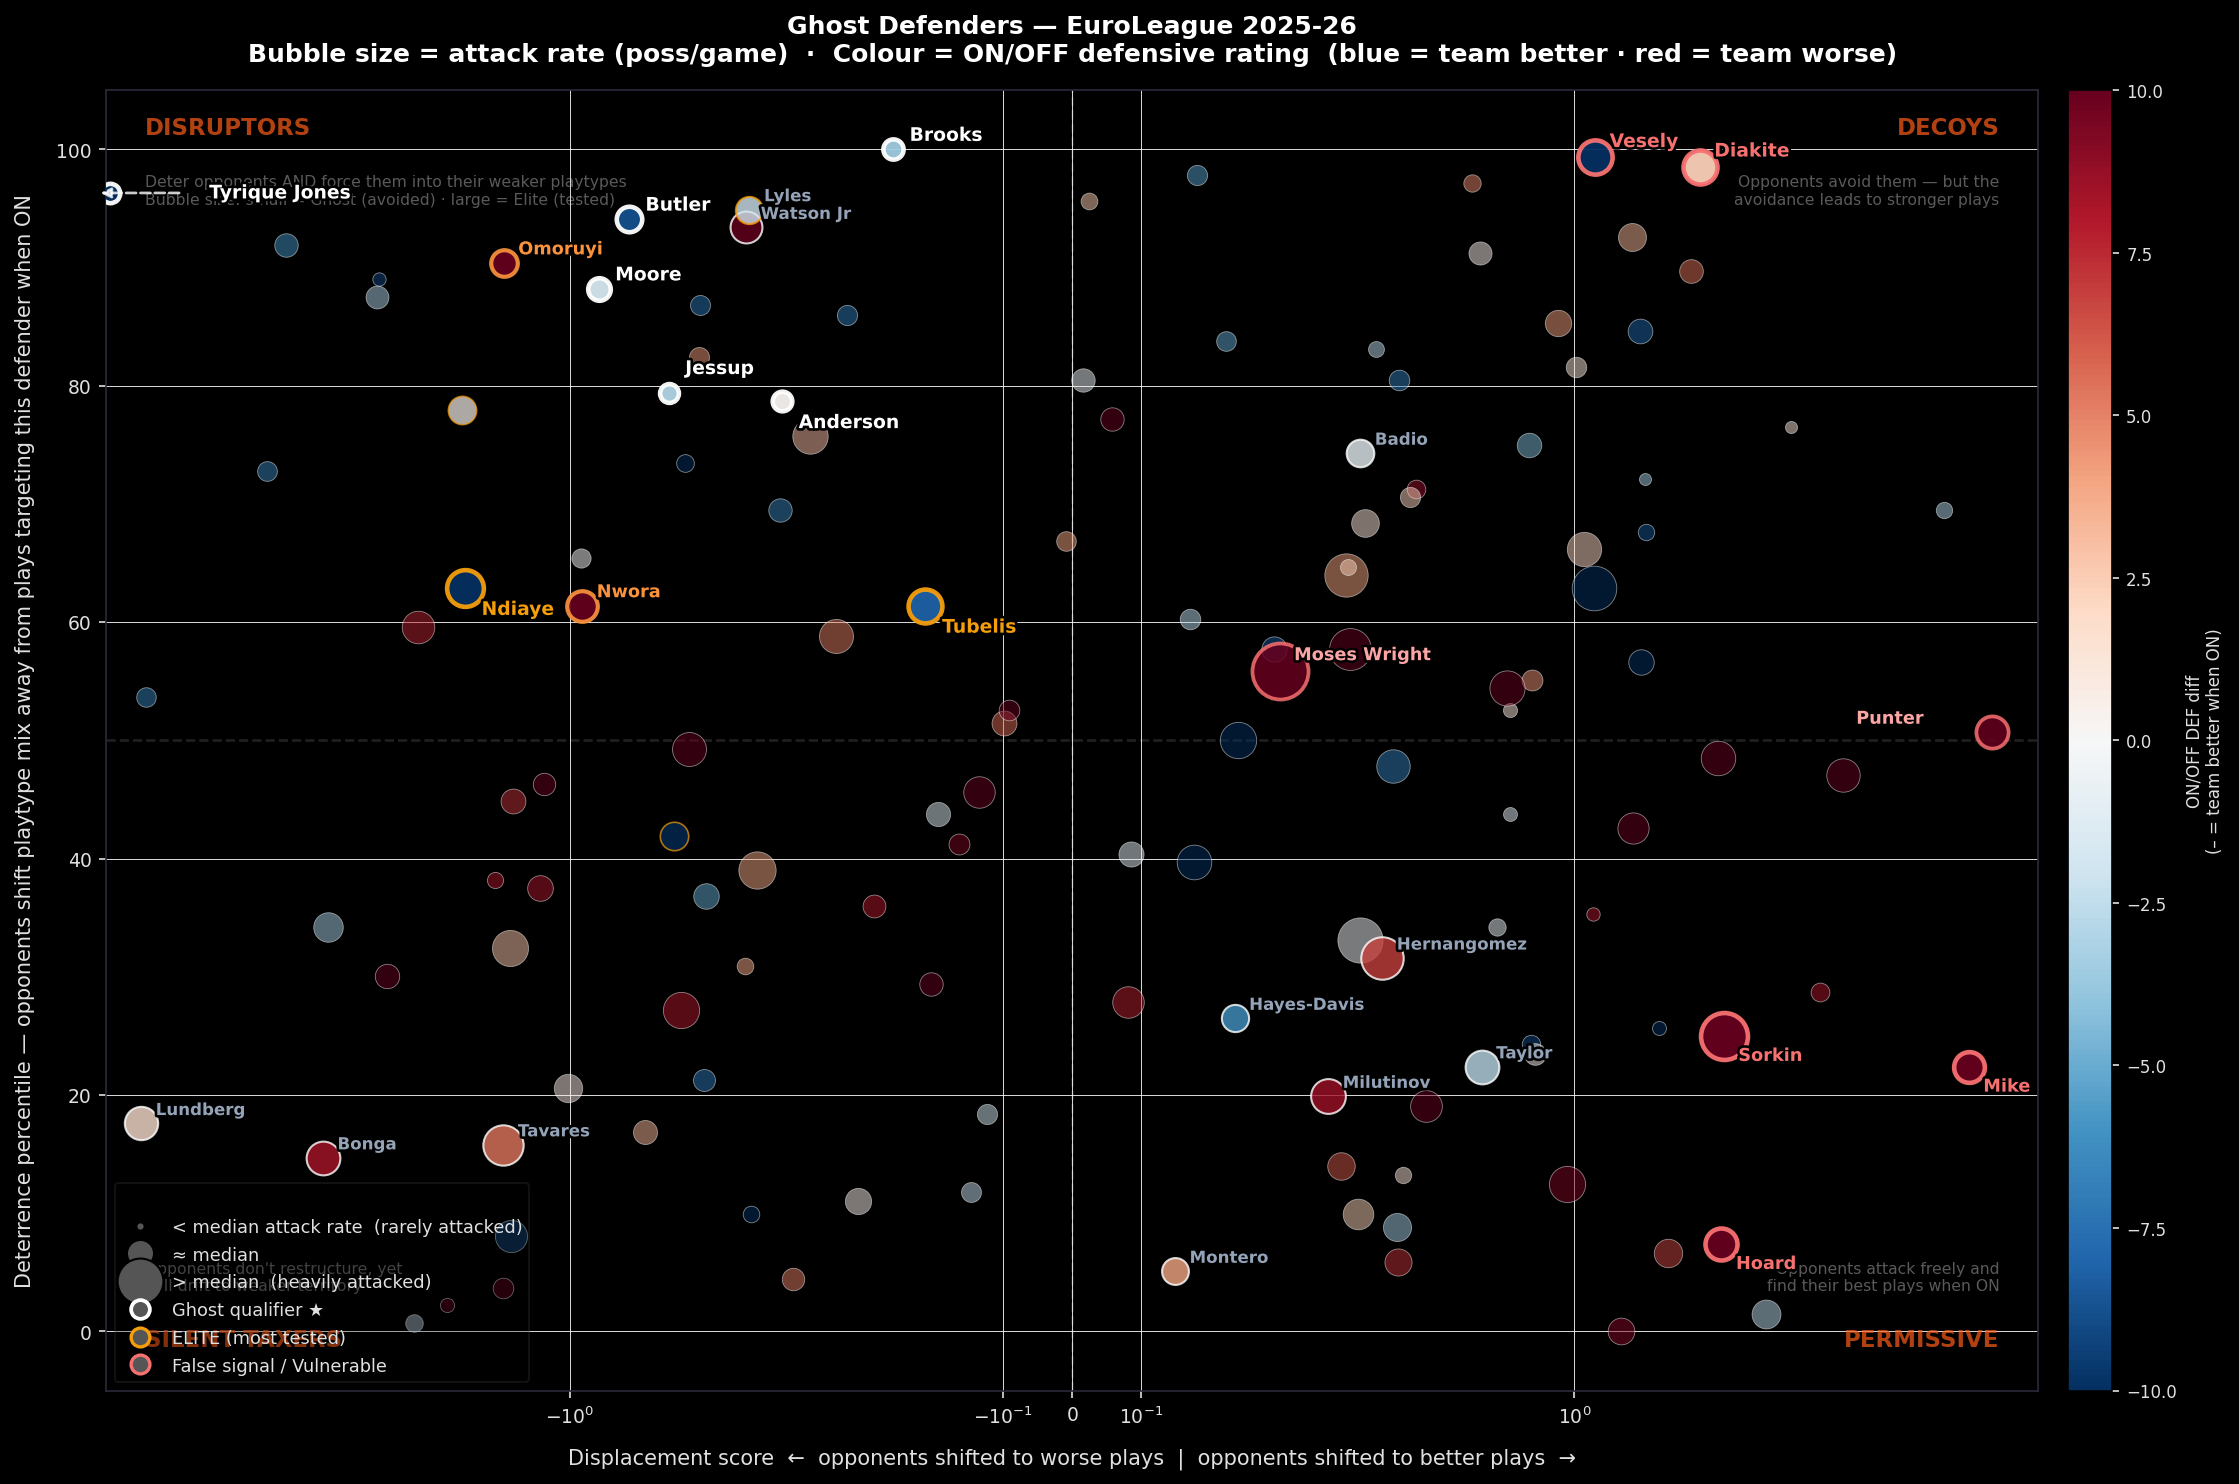
Four quadrants. Four very different types of players.
In the top left — the DISRUPTORS. These are the players who do both things right. Opponents restructure significantly when they are on the court, and the restructuring costs their offensive efficiency. They are pushed out of their preferred plays into territory where they are weaker. The small bubbles in this quadrant, the rarely-attacked ones are your ghost defenders. Opponents have decided, collectively, across an entire season, that attacking them is not worth it. The large bubbles are the elite: tested heavily and still forcing this outcome. Both are extraordinary. The ghost is just more invisible about it.
In the top right — the DECOYS. This quadrant is the most dangerous one for scouts to misread. These players have high deterrence. Opponents do restructure around them. But the restructuring leads opponents toward stronger plays. Something about this player's presence, perhaps a positional vulnerability, perhaps a tendency to pull coverage in a way that opens something better is pointing opponent offenses toward their best options. The deterrence is real. The consequence of that deterrence works against the team. In a transfer window, a DECOY can look almost identical to a DISRUPTOR on surface-level numbers. They are not.
In the bottom left — the SILENT TAXERS. Opponents don't reorganise much around these players. The deterrence is low. But when the offense runs, they still tend to drift into weaker playtypes. There's a quiet drag here that doesn't announce itself. These players are often underappreciated because nothing dramatic happens. No visible deterrence, no headline moment. But the aggregate effect, accumulated over 34 games, is real. Some of the most quietly valuable defensive assets in this league live in the bottom left.
In the bottom right — the PERMISSIVE. Opponents attack freely and, in doing so, find their best plays. This is the quadrant every club wants empty. It means a player's presence, over the course of a season, reliably makes the opponent offense more efficient. Whether it is poor positioning, a predictable help tendency, or simply a physical mismatch that opens everything else. The result is the same. High on the shortlist. Should not be.
One more dimension before we go deeper. The colour of each bubble maps the player's team-level ON/OFF defensive rating. Blue means the team gets better defensively when he is on the court. Red means they get worse. A top-left DISRUPTOR who is also blue is the dream. A top-left DISRUPTOR who is red is one of the most interesting tension points in the data, they are forcing opponents into weaker plays, yet something else in their game or their lineup chemistry is offsetting it. These players exist. They deserve a conversation.
The Ball-Screen Wall
Tyrique Jones of Olympiacos, season 2025-2026
One player in our dataset does not fit on the chart at all. Tyrique Jones.
He sits at the 96th percentile for deterrence. His displacement score is –16.7. The next most extreme value in the dataset is –3.8. Jones is so far to the left that we pinned his bubble to the axis edge and drew an arrow.
What does –16.7 actually mean? It means that when Jones is on the court, across every opponent he faced this season, teams shifted their playtype distribution away from their strongest plays and into plays where they were, on average, 16.7 points per 100 possessions worse than their baseline. That is not a marginal effect. That is a game-plan dismantling.
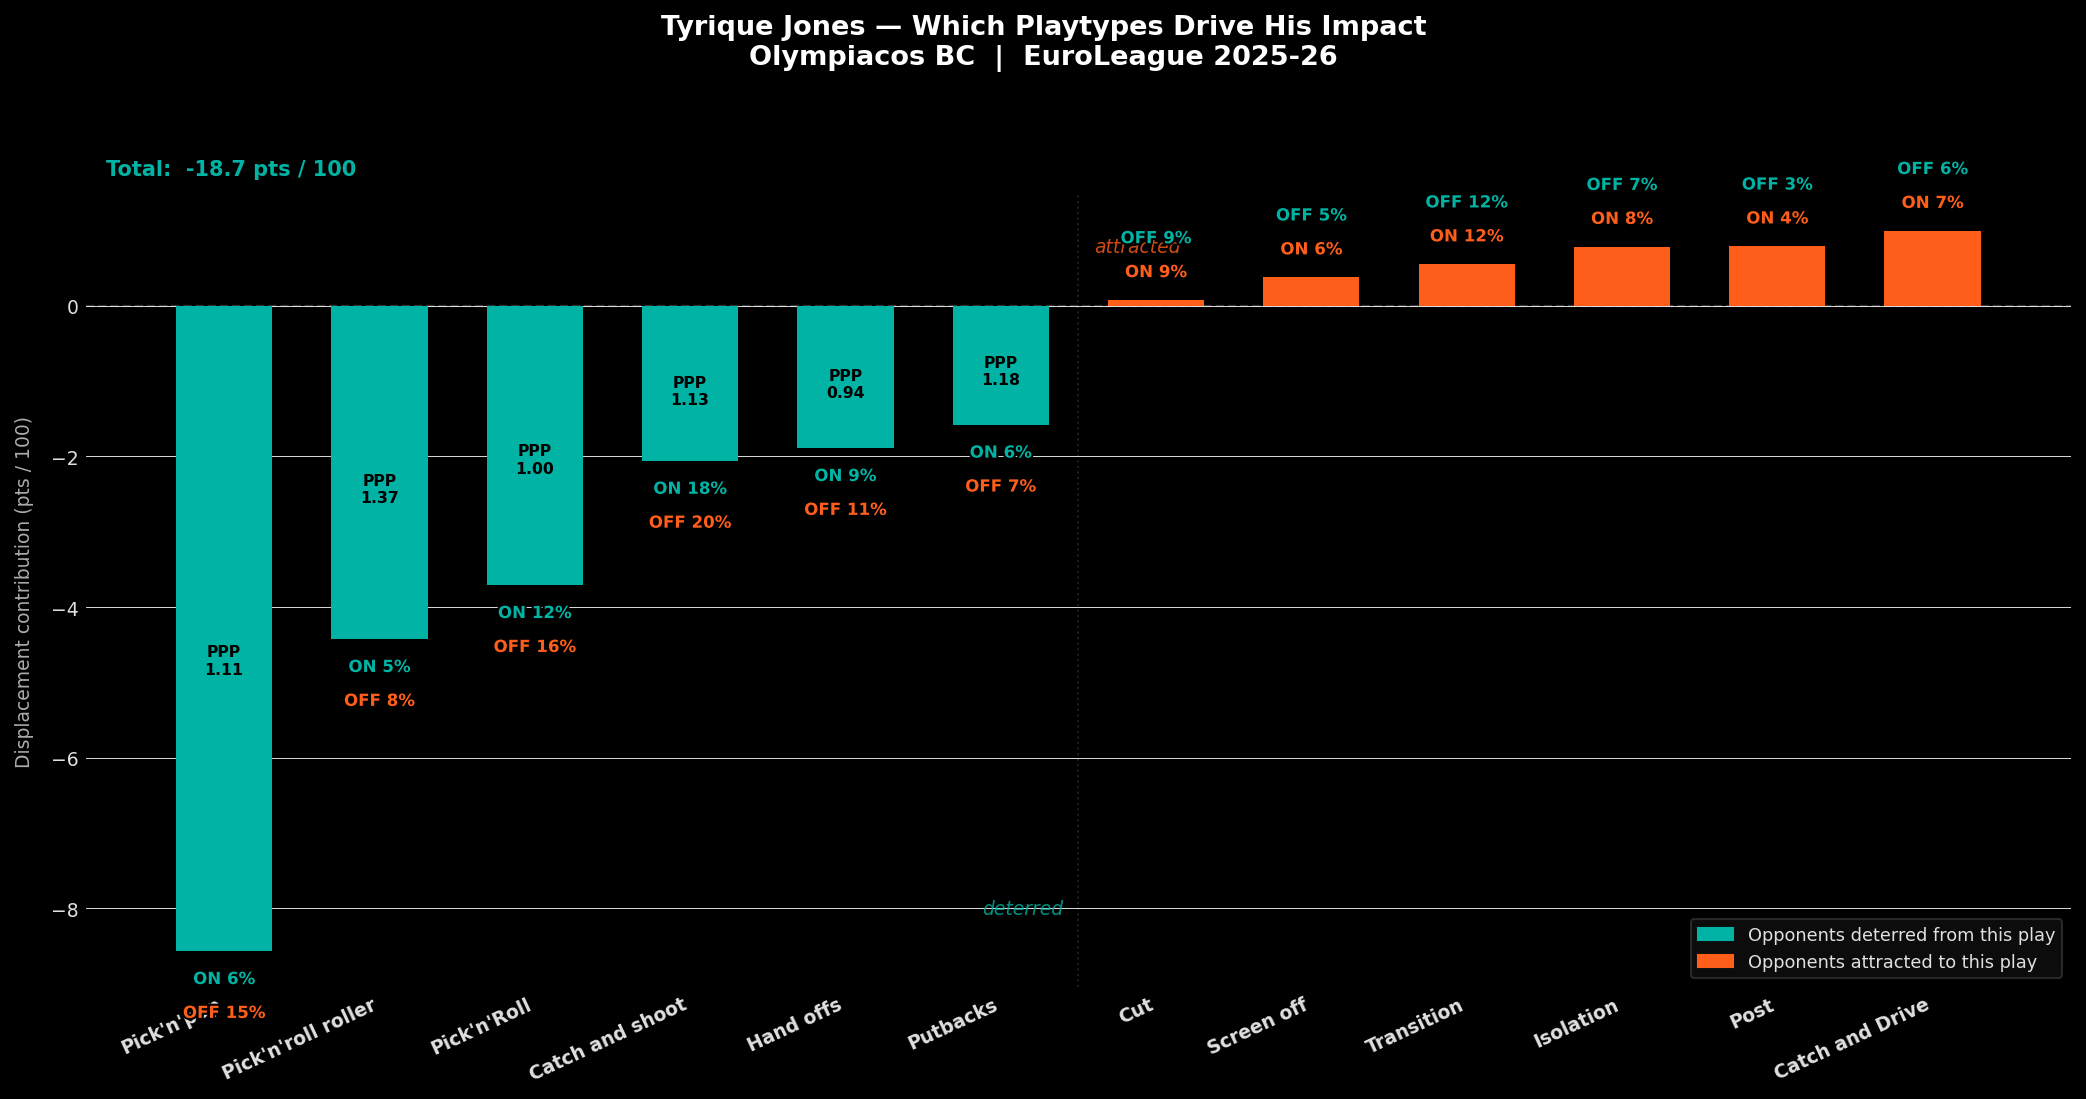
Jones Playtype Displacement Breakdown — ON vs OFF frequency shift per playtype, weighted by opponent season PPP
When Tyrique Jones is on the court, teams stop running ball-screen offense. Not some of it. Not the weakest variants. All of it. Look at the three teal bars on the left. They are not three separate plays. They are three different reads off the same action, the pick-and-roll. The ball handler keeps it and attacks (Pick'n'Roll, –3.71). The screener rolls to the basket (Pick'n'roll roller, –4.43). The screener pops out for a jump shot (Pick'n'pop, –8.57). Every single option a team has coming off a ball screen shrinks dramatically when Jones steps onto the floor.
The Pop number is the one that stops you. Opponents run the pick-and-pop 14.7% of their possessions when Jones is off the court. When he comes on, that drops to 6.3%. Across a 100-possession game, they run nearly nine fewer pop actions. And the pop is efficient, opponents average 1.11 points on it. That is not a weak play they are abandoning. That is a primary weapon they are choosing to holster.
Then look at the roller. At 1.37 PPP, the pick-and-roll roller is the single highest-efficiency play in this entire dataset. Opponents know it. Coaches draw it up. And yet when Jones is on the court, teams run the roller 7.9% of the time without him and just 4.6% with him. Nearly a 40% reduction in their most efficient ball-screen option.
Add up the three ball-screen bars and you are looking at roughly –16.7 pts/100 from Pick'n'Roll alone. Jones does not shrink one entry point into ball-screen offense. He closes all three simultaneously.
The Hand offs and Catch-and-shoot bars complete the picture. Hand offs are a ball-screen variant, the screener hands the ball off on the move. Fewer ball screens means fewer hand offs. Fewer pop actions means fewer screeners drifting to three-point range for catch-and-shoot looks. Jones's presence does not just deter a play. It dismantles an entire offensive system.
What does this mean for a club evaluating Tyrique Jones as a transfer target?
It means the question is not "how many points does Jones allow in Pick'n'Roll defense?", because the answer to that question is statistically sparse. Opponents barely run Pick'n'Roll against Olympiacos when he is on the court. The question is: what is worth 8 fewer ball screens per 100 possessions?
THE MOST ATTACKED MAN
Moses Wright of Zalgiris, season 2025-2026
Moses Wright is the most attacked defender in EuroLeague 2025-26, and not by a small margin, but definitively. At 10.1 possessions per game, he sits at the 100th percentile for attack rate. Every team in the league has a plan for him. On the scatter chart, he sits right on the vertical dividing line, just barely into DECOYS. That number makes him sound harmless. The ON/OFF differential of +15.3 points per 100 tells you the reality.
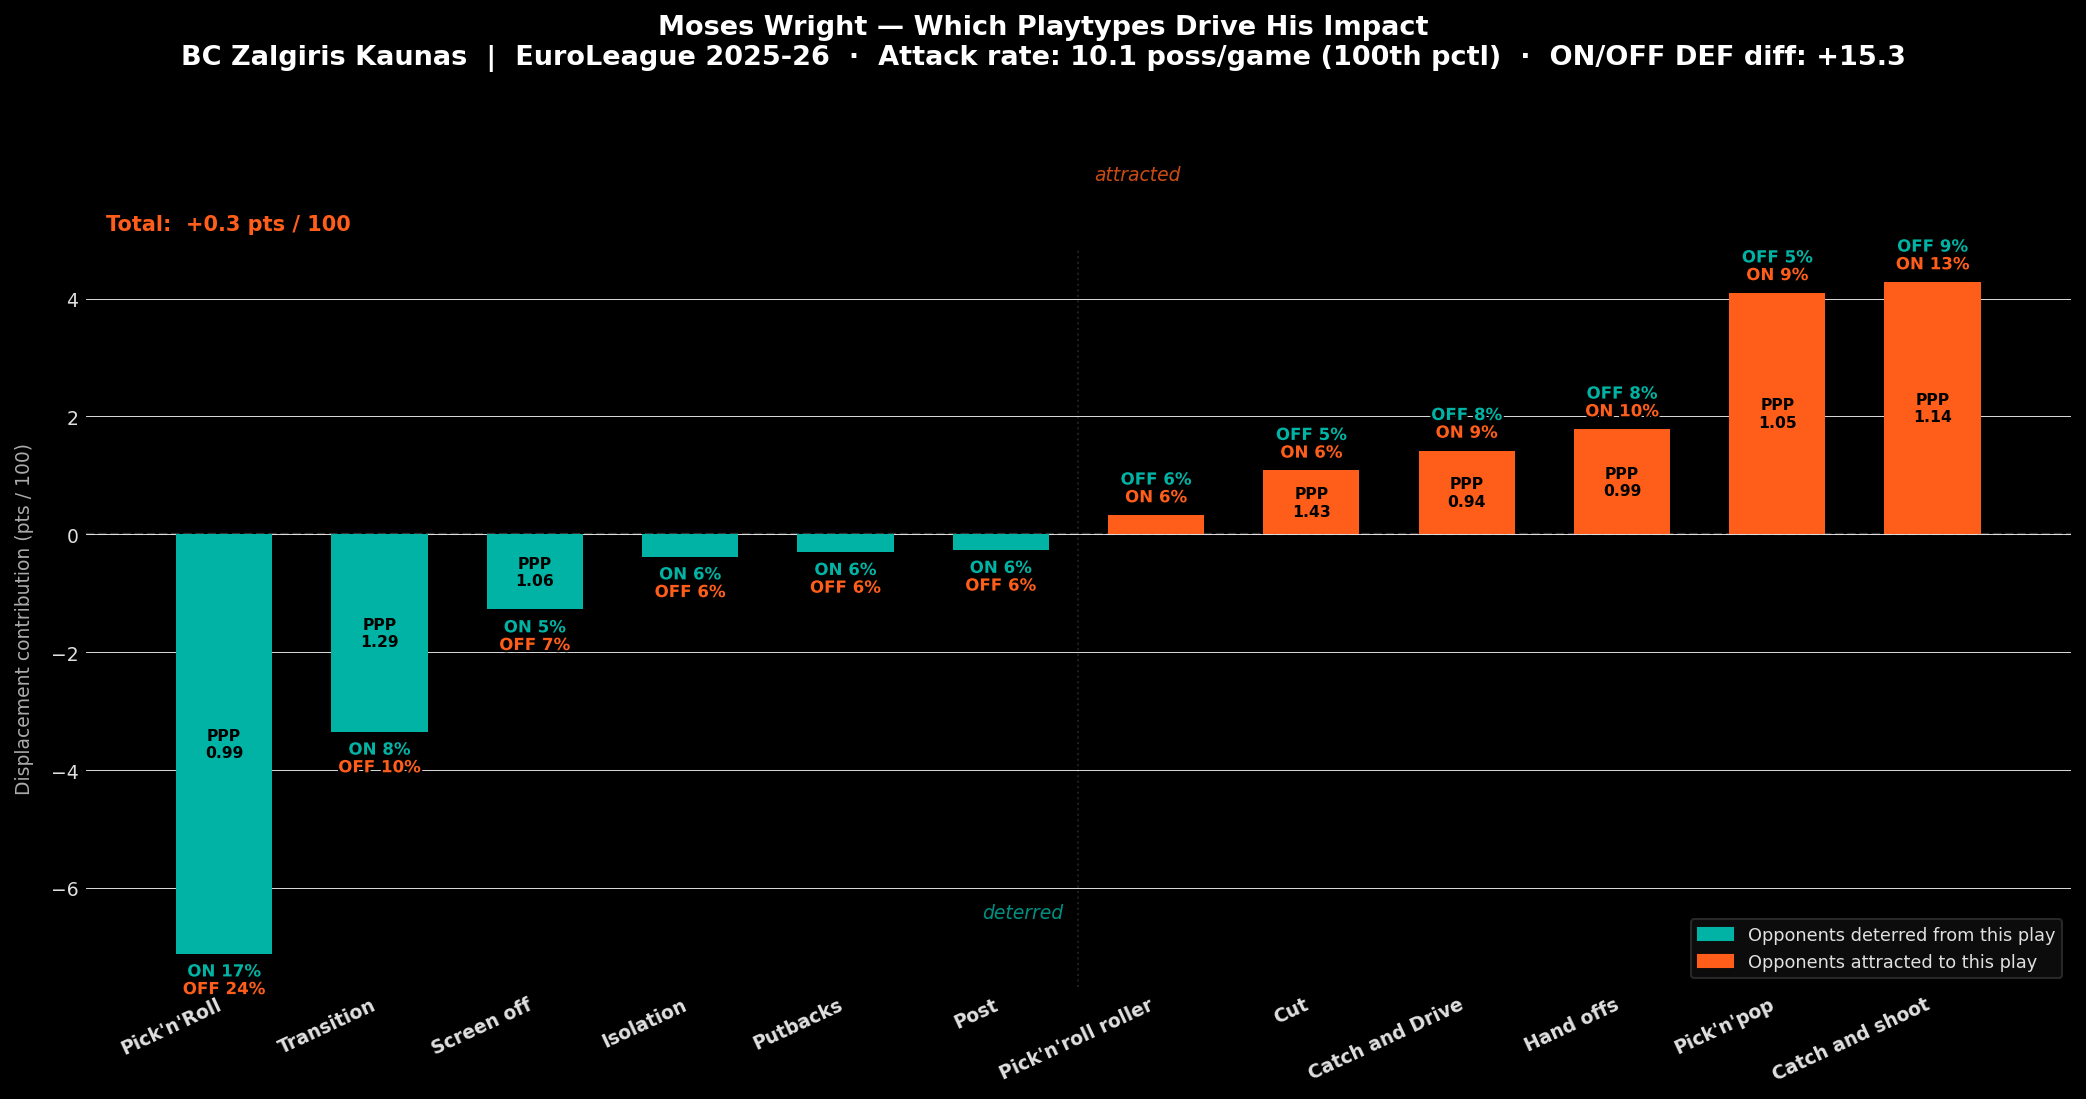
A horizontal bar chart breaking down Moses Wright's displacement by playtype
Wright is genuinely good at one thing: shutting down pick-and-roll penetration. When he's on the floor, teams run 7.3 percentage points fewer PnR actions, a contribution of −7.1 pts/100. That's not nothing. Transition is also suppressed (-2.6pp, -3.35 pts/100): his size slows the game in the open floor. But the basketball is more ruthless than the deterrence score suggests. Teams don't abandon the PnR, they mutate it.
Catch-and-shoot jumps from 9% to 13% of offensive possessions (+3.8pp, PPP 1.135) when Wright is on the floor. Pick-and-pop nearly doubles from 5% to 9% (+4.0pp, PPP 1.055). The mechanism is obvious: opponents attack Wright in PnR, he hedges or helps to contain the drive, and the screener pops to the three-point line. The ball-handler skips it. Wright can't close out. Shooter fires. The same principle funds the catch-and-shoot volume. Spacing around the PnR gives perimeter players shots that Wright can't contest. His deterrence of penetration is real. It's also being systematically harvested as spacing for three-point shooters.
The −7.1 pick-and-roll gain is almost exactly canceled by +4.3 catch-and-shoot and +4.1 pick-and-pop losses. Net displacement: +0.3 pts/100. The gains and the costs balance to nearly zero, but that zero is not neutrality. It's a constant churn of 10+ possessions per game where opponents are converting one attack into a better one, at high volume, with a defense that loses 15 points per 100 in the process.
Wright's deterrence score (55.9th percentile) is the most misleading number in his profile. He reshapes offensive patterns, just not in his team's favor.
SAME SAME, BUT DIFFERENT
Armoni Brook of Armani Milano, season 2025-2026
Armoni Brooks and Kameron Taylor land in the same category: athletic, point-of-attack perimeter defenders. They both guard ball-handlers as well as off-ball. They both play significant minutes in EuroLeague. The chart above shows why that label obscures more than it reveals. Taylor's ON/OFF is -2.6, marginally positive for the team. Brooks's is -3.5, also positive. By net defensive rating alone, they look nearly identical. The playtype breakdown is where the distinction becomes visible.
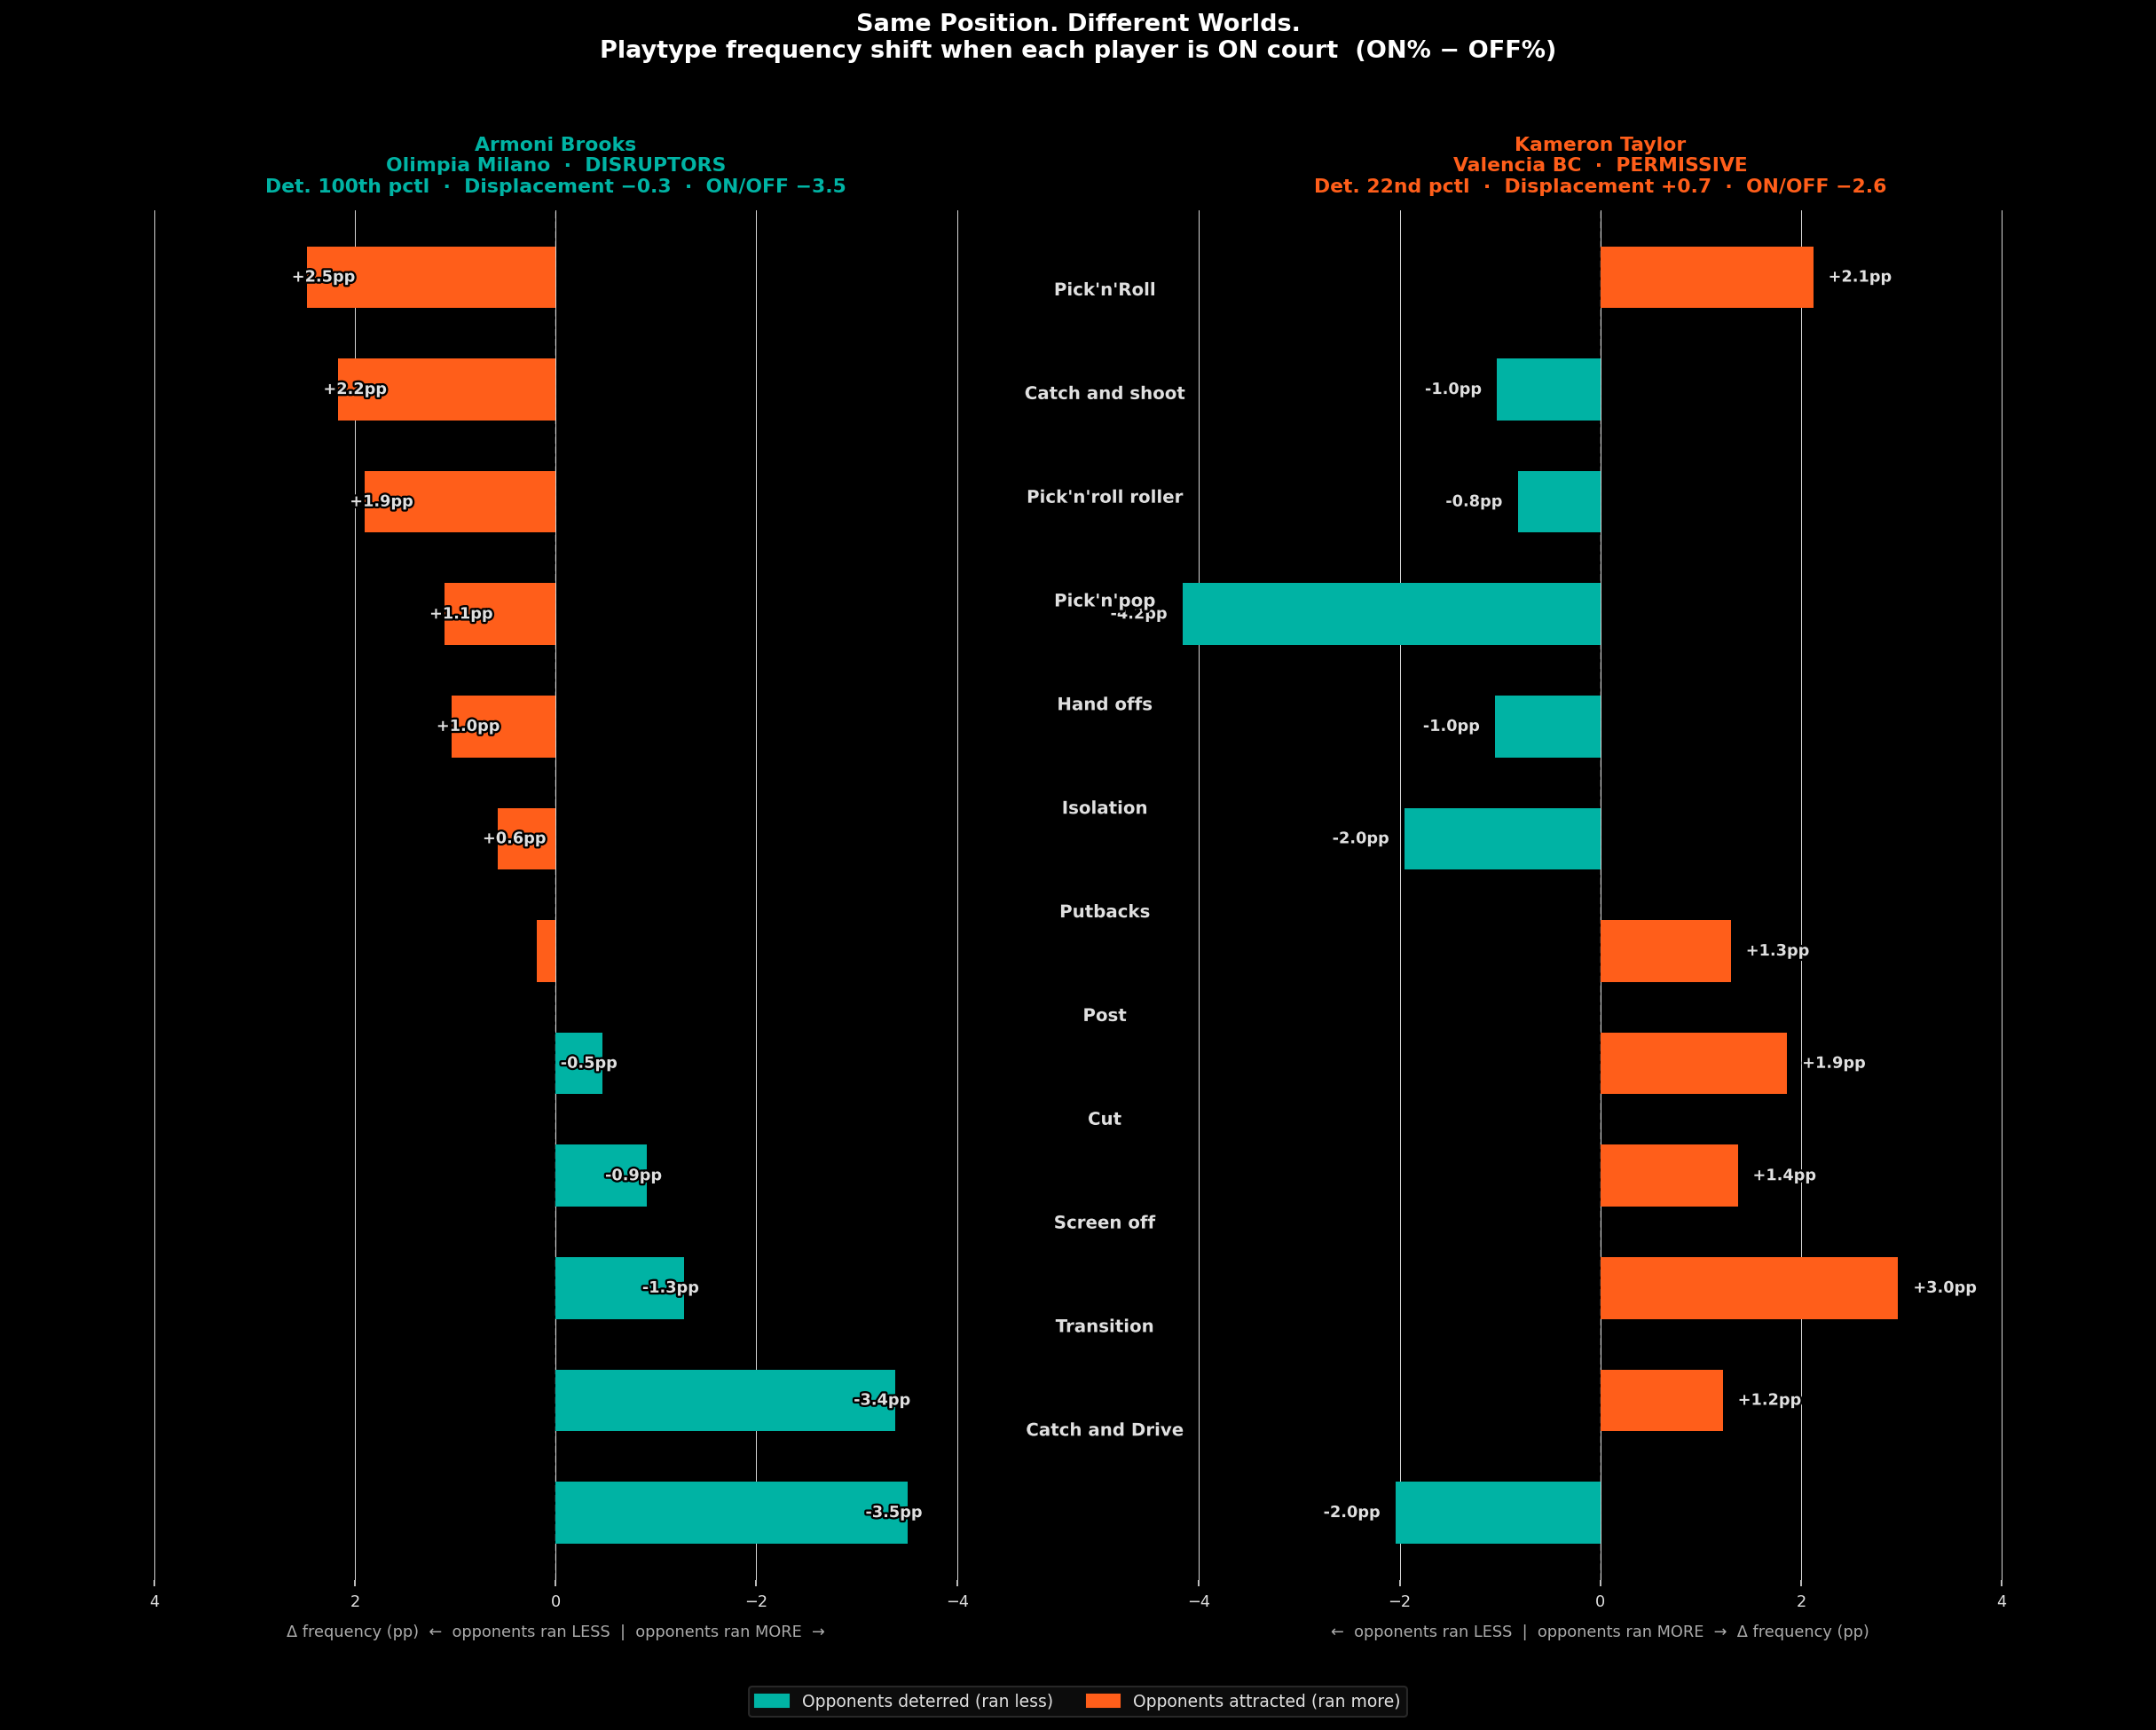
A side-by-side comparison between Armoni Brooks and Kameron Taylor defensive deterrence vs. displacement.
Armoni Brooks sits at the 100th percentile for deterrence. That number is almost abstract. It means that across 19 qualifying opponents, no defender in EuroLeague reshapes offensive intent as completely as he does.
The two biggest teal bars are the story: Catch and Drive drops 3.5 percentage points when Brooks is on the floor (from 8.8% to 5.3%). Transition drops 3.4pp (from 13.2% to 9.8%). These are not subtle adjustments. They represent teams consciously choosing not to push the ball in the open floor and not to attack off the dribble, because Brooks is there, and they know what happens when they try.
Kameron Taylor is attacked at the 82nd percentile. He is physically in the fight. And he wins some of those individual battles: Pick'n'pop drops 4.2pp when Taylor is on (from 10.3% to 6.2%). Catch and Drive falls 2pp. Isolation drops 2pp. These are real defensive wins, play by play.
But the net displacement is +0.734. Opponents end up in better territory when he's on the floor. How? The orange side tells the story. Screen off jumps 3.0pp (from 4.0% to 7.0%). Post increases 1.9pp. Cut rises 1.4pp. PnR grows 2.1pp. These are all plays that flow naturally from half-court set offense and they're plays where opponents are strong. When Taylor takes away the isolation and the pick-and-pop, teams don't retreat. They substitute with a fuller menu of half-court actions, and that menu is loaded.
The key difference: Taylor's deterrence redirects opponents into plays they're actually good at. Brooks's deterrence redirects opponents into plays they have to settle for.
WHAT DOES THIS MEAN FOR TEAMS IN THE MARKET
The transfer window, for most clubs, is a negotiation between what you need and what you can afford to trust. Defensive players are hard to evaluate precisely because the best ones make offense disappear. There is no box score column for possessions that never happened. But the absence of attacks is information. When it accumulates across 34 games, 137 opponents, across every EuroLeague roster in a season, it starts to tell you something that PPP-allowed never can.
THE ANSWERS HOOPWISE CAN reveal
We opened with a sporting director and a shortlist sorted by PPP-allowed. The number looked clean. The process looked rigorous. But it was measuring the wrong thing.
The question was never just: how much do opponents score when they attack him?
The question was always: does his presence on the court make opponents worse?
And now, for the first time with EuroLeague data, we have a framework to answer it. Not just directionally, but precisely. Who forces the restructuring. Who makes the restructuring costly. Who looks like a deterrent but silently opens doors. Who gets attacked and makes opponents better by accepting it. The best defensive players in this league are not always the ones with the most defensive possessions. Some of them barely have any. They have been doing their best work in the plays that were never called, the pick-and-rolls that were waved off, the post-ups that disappeared from the game plan before the ball ever crossed half court.
They have been defending before the offense starts.
That is defensive gravity. And now you can see it.